

bakery (Photo credit: Sachiho)
Slovenia is a small country. it’s a fact, but unfortunately this realization is too often used as an excuse to not do something right. In my opinion, this means two other things:
- because it’s a small country, we can have much better overview of activities, if only we choose so. our national statistics centre is able to produce monthly insights into many aspects of the society without much effort, so we actually have data available that could be used to empower better decisions easily.
- because we don’t have infinite pool of human resources, we have to be more careful on where we employ them.
I don’t see enough efforts on either part, and I’m pretty sure very few people in slovenia are actually aware of the actual distribution of human potential of the country, which results in lots of ungrounded frustrations and much ranting about “too big government sector” or “too little economic growth“, without data to back it up.
So i wanted to get better sense of what our high level structure is. here is first draft of a breakdown of slovenian population:
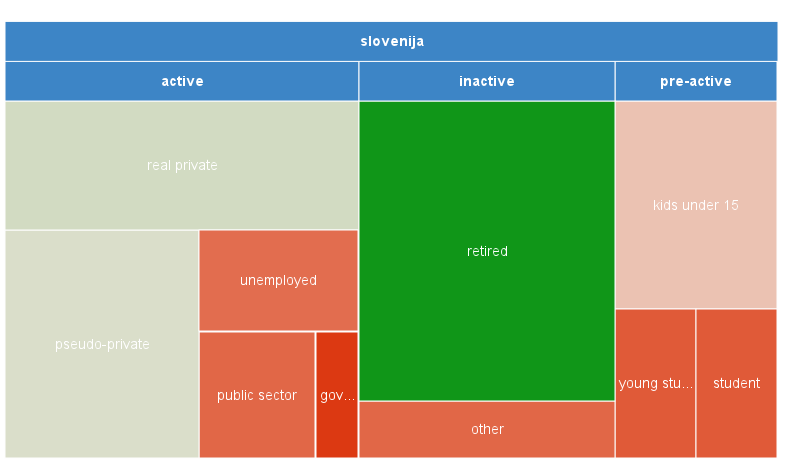
… every slovenian resident can find herself in exactly one of the squares. now we can observe some interesting facts, some that we have known before, and some that might be a surprise:
- government is not so big. 40.000 people work across the administration. the same for public sector – all our education and health is run by only 5% of the population
- i ventured into separating private sector into two halves – the pseudo-private sector are people employed in companies that are funded mainly from public sources. i’ll get more accurate data, but i believe this distinction is important, because those companies are not actually creating value on the market, but rather live off national budget.
- so my theory is, that until we get more people from all other buckets into the real private sector, there is little hope of solving the economic crisis. if all our growth is dependent on government projects, and only 16% of people daily work on and think about adding value to the
complete data table is:
| sector | group | headcount | percent |
|---|---|---|---|
| slovenija | 2,050,000 | 100.00% | |
| pre-active | slovenija | 430,000 | 20.98% |
| active | slovenija | 940,000 | 45.85% |
| inactive | slovenija | 680,000 | 33.17% |
| kids under 15 | pre-active | 250,000 | 12.20% |
| young students | pre-active | 90,000 | 4.39% |
| student | pre-active | 90,000 | 4.39% |
| government | active | 40,000 | 1.95% |
| public sector | active | 110,000 | 5.37% |
| pseudo-private | active | 330,000 | 16.10% |
| real private | active | 340,000 | 16.59% |
| unemployed | active | 120,000 | 5.85% |
| other | inactive | 110,000 | 5.37% |
| retired | inactive | 570,000 | 27.80% |
i’m imagining next steps for this visualization will be:
- make it update itself from monthly data
- add more complexity, adding ability to drill into individual sectors
- create a comparable breakdown of added-value, or contribution to GDP, or something similar, to back my thesis that we need more people in the real private sector.
thoughts? what else do you see in the chart?
Related articles


